We evaluated 100 fintech signups. Here is what we found.
The Auxos Fintech Onboarding Friction Index, Q1 2026
Signing up for a financial app should be simple. Pick an app, hand over some basic information, and you are in. In reality, most people do not make it that far.
Drop-off during onboarding is one of the biggest and most invisible problems in fintech. Companies spend heavily to bring users to their signup page, only to lose them somewhere in the flow. Too many steps, confusing language, a trust moment that does not land, or a slow and frustrating process. The user gives up, and the company never finds out exactly why.
At Auxos, we built a way to measure this before it becomes a problem. We run swarms of AI personas through digital products the same way real users would, and we capture everything. How long it takes. Where they hesitate. When they fail. What they feel. The result is a detailed behavioral picture of what your onboarding flow is actually like for the person going through it.
This report is our first public look at what that data shows across the fintech industry.
What We Did
We selected 10 consumer fintech apps across categories including investing, banking, trading, payments, and wealth management. For each app, we ran AI personas through the full signup flow. Each persona has distinct behavioral traits, from risk tolerance and tech comfort to communication style and hesitation patterns.
We then scored each company across four dimensions: how complex the flow is structurally, how much cognitive effort it demands, how much trust it builds or erodes, and how well it handles friction and errors. Those four scores add up to a total Onboarding Index out of 100.
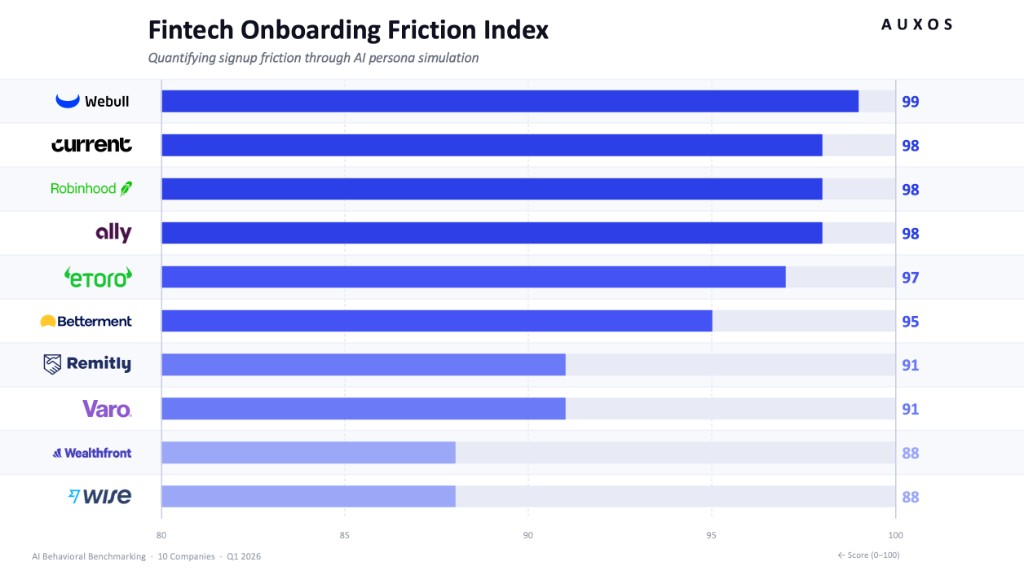
The Overall Rankings
The results span a meaningful range. Webull, Current, Robinhood, and Ally all scored 98 or above, meaning their onboarding flows are clean, fast, and trust-building across nearly every dimension. Wealthfront and Wise came in at 88, leaving real room for improvement.
A few points might not sound like a big difference, but in practice each point represents a specific friction source that a real user is hitting. At scale, that translates directly into lost signups.
Breaking Down the Score
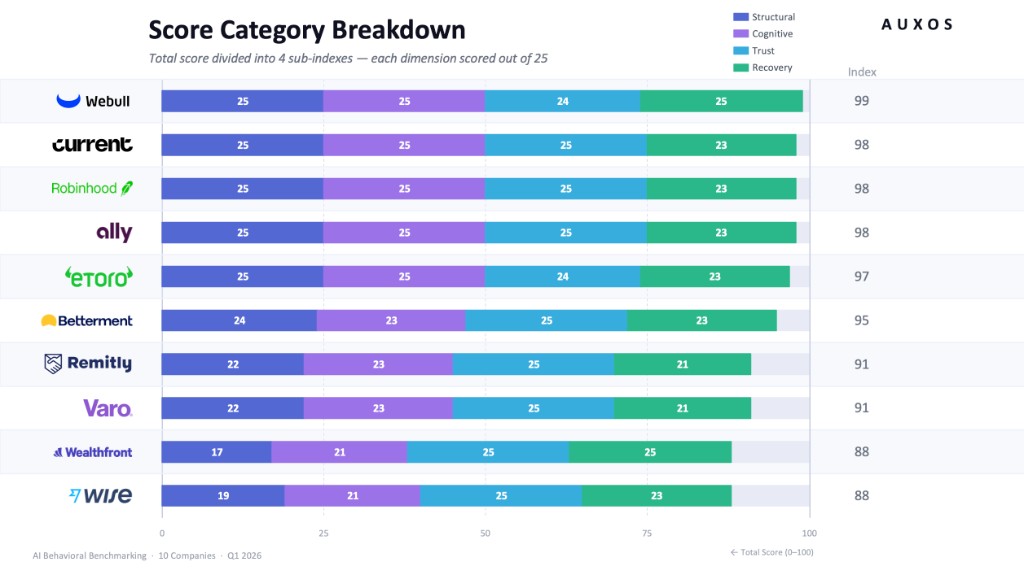
The overall score is built from four sub-scores, each worth 25 points.
Structural measures the raw complexity of the flow: how many screens, how many required fields, how many redirects or authentication steps. A high Structural score means the path to completion is clean and short. A low score means the flow is asking too much before the user is even committed.
Cognitive measures how hard the flow is to think through. Even a technically short flow can be exhausting if decisions stack up quickly. This score captures the mental effort the signup demands.
Trust measures whether the flow makes the user feel confident or cautious. Financial apps ask for sensitive information, and that requires the right tone and timing. Our AI personas flag moments where they hesitate or express negative sentiment, and this score reflects how many of those moments appear.
Recovery measures what happens when something goes wrong. A step fails, an input is rejected, or a session stalls. Apps that handle those moments well keep users moving forward. Apps that do not lose them.
Time on Task and Drop-Off Risk
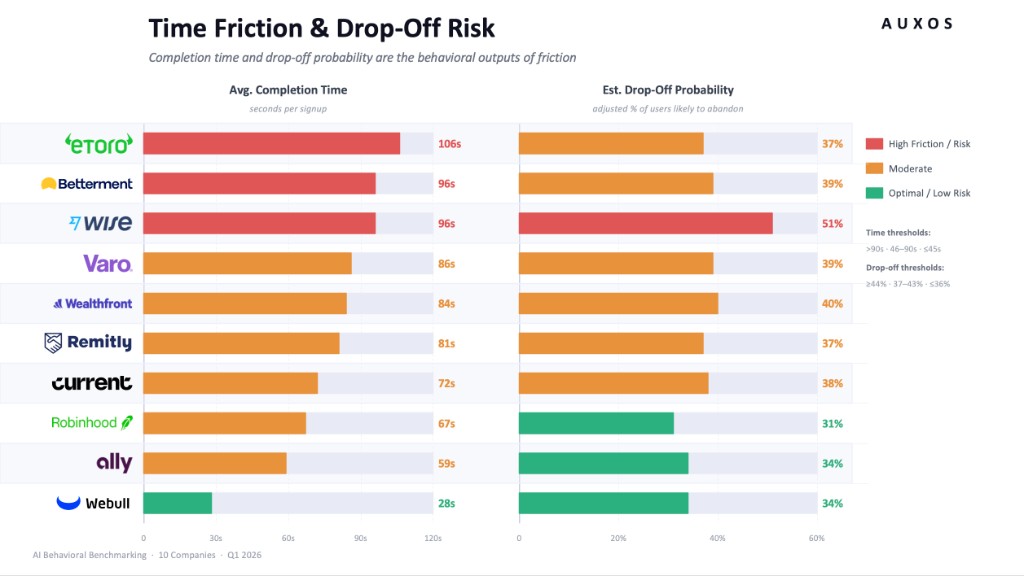
Speed matters. Our data shows completion times ranging from 28 seconds for Webull to over 100 seconds for eToro. That gap is significant. Every extra second in a signup flow is another moment where a user can reconsider.
Alongside completion time, we estimate a drop-off probability for each app. This is not just about time. It factors in the overall friction score and the conversion rate observed across our simulations. Wise came in highest at 51%, meaning roughly half of users who start that flow may not finish it. Robinhood sat at the bottom of the risk range at 31%.
These numbers are not hypothetical. They reflect the behavioral patterns of 100 simulated users making the same choices a real person would.
How We Score It
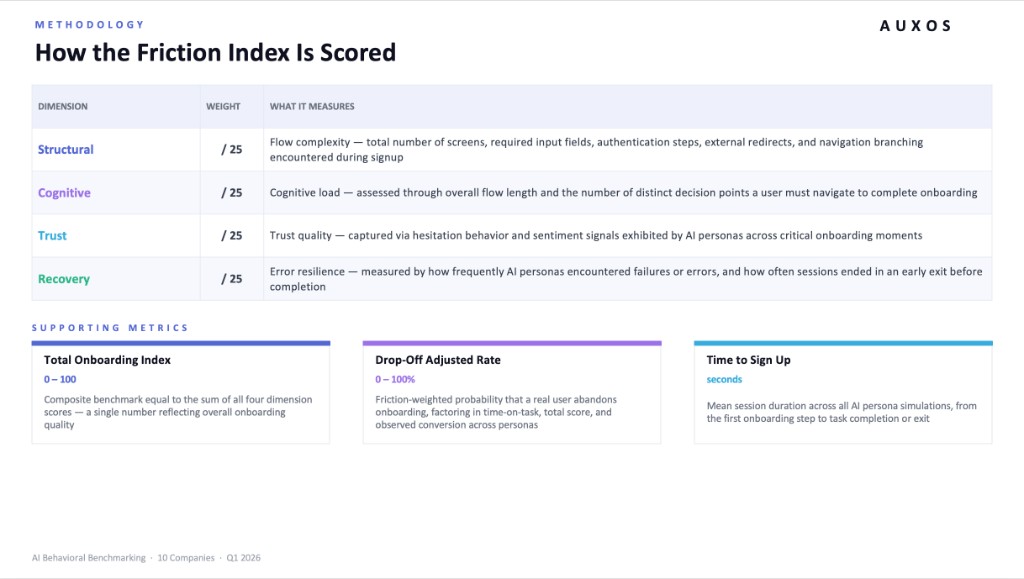
Our scoring model is built around four independently measured dimensions, each grounded in specific behavioral signals our AI personas generate during the simulation. Structural and Cognitive scores reflect the observed complexity of the flow. Trust and Recovery scores come directly from persona behavior: hesitations, sentiment shifts, failed steps, and early exits.
The drop-off estimate combines time, score, and conversion into a single probability. Time to sign up is the average session duration across all personas, whether they completed the flow or not.
The goal is not to produce a league table. It is to give product teams a clear, measurable picture of where their onboarding is working and where it is not.